
Personal Activity Travel and Location Allocation Simulation
HBA has developed and implemented a particular form of advanced disaggregate activity-based, tour-based personal travel model framework, called the Personal Activity Travel and Location Allocation Simulation, or ‘PATLAS’, in a number of jurisdictions, including the State of California, the San Joaquin Valley, the Calgary Region, Edmonton Region and Province of Alberta. Because of the large size of some of these jurisdictions – up to 50 million people in future horizons – for practical use, PATLAS is focused on operational speed.
The PATLAS framework is a disaggregate model, considering individual households and people from a synthetic population. There are four broad levels of decisions that are made; long term decisions that affect all aspects of travel, day pattern decisions that determine the activities an individual performs in the day, tour level decisions considering an entire tour and trip level decisions regarding specific trips.
Long term decisions include driver’s license holding, household level auto ownership, work and school location (including work at home). They also include other similar long-term mobility decisions as appropriate for the region under study, including identifying workers who need their car at work, transit pass choice, household bicycle ownership and subsidized work parking provision.
Day pattern decisions consider the role of the day – if the person goes to work, school, both, travels for other purposes or does not travel at all. Within these day roles, a holistic day pattern group is chosen that represents the principal dimensions of travel, such as the purpose, number and broad time period of tours, and then a specific day pattern of out-of-home activities is assigned to each person, producing trips and tours in a variety of activity purposes.
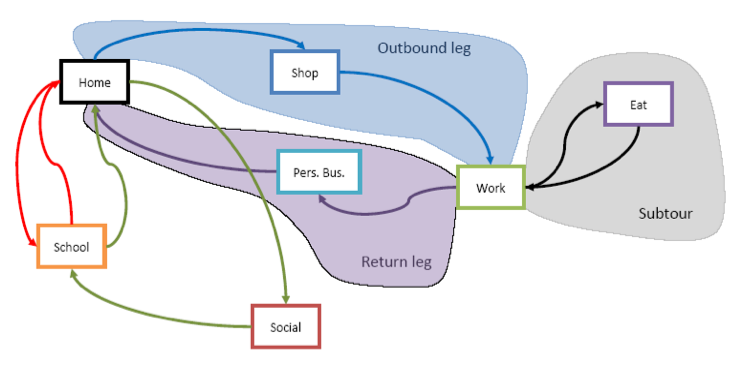
Tour level decisions consider each tour made by a resident – a tour is the chain of trips beginning at and eventually returning to the home. Each tour has a purpose and primary destination that represents the most important destination on the tour. For instance, on a work tour, the work location is assumed to be the primary destination even if the person goes out to lunch at noon and stops to do shopping afterward. In addition to choosing the primary destination location, a tour mode (or mode group) is chosen.
Individual trips within the tour are the final level of decisions simulated. Each trip has a destination assigned, considering how far out of the way that destination is. Individual trips also get modes, which are limited by the tour mode – someone who drives a car from home in the morning is not permitted to abandon it halfway through the tour, and someone who takes the bus to work can’t decide to pull a car out of their pocket when it would be convenient later. Trips can be assigned into individual time periods using a peak spreading model.
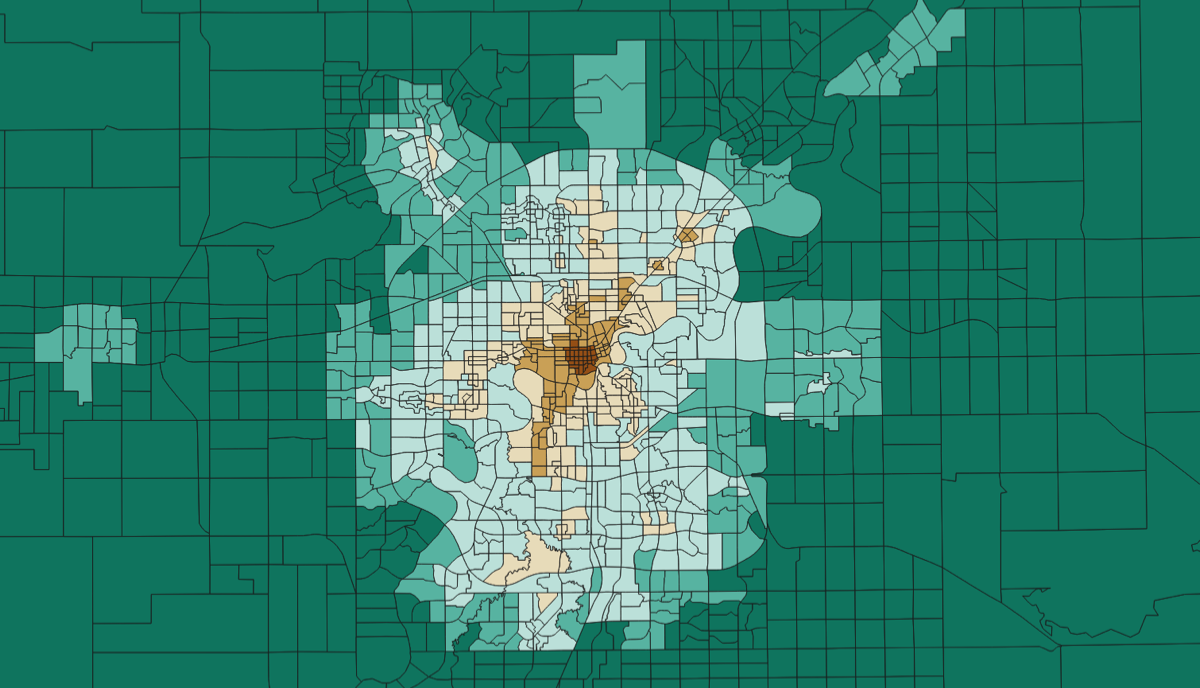
Driver's license probability in Edmonton, Alberta
PATLAS relies on the economic theory of individual choice behaviour and on the higher degree of precision available with a representation at the level of the individual traveller, meaning it can take into account (a) influences at the individual level, such as the walking distance to the bus stop for each person, (b) constraints at the household level, such as the number of cars in a household, and (c) can consider specific activity patterns and therefore provide more accurate indications of behaviour. The demand model component is implemented in Python. PATLAS produces individual trip record output for each person in the model study area; the results are very similar to a household travel survey. These trip records are aggregated to give trip tables for use in network assignment.
Models can only be useful if they are responsive to policy questions. This includes having appropriate behavioural sensitivities to the policies under question, but it equally applies to the ability of the model to produce the results in a reasonable time frame. Sample single iteration demand model runtimes on a single computer (32 GB RAM, 4 core processor from 2017), starting with reading network skims and ending with producing new trip lists are as follows:
Alberta production model – approx. 1100 zones (under consideration for any given individual); 3.6 million people making 13.1 million trips: 45 minutes.
Alberta testbed – 3400 zones; 3.6 million people making 13.1 million trips: 66 minutes.